Amazing Data Sources for Data Visualization
In this blog, I am going to talk about some amazing data sources for data visualization. Data visualization is one of the core skills in data science. To start building useful models, we need to understand the underlying dataset. You will never be an expert on the data you are working with, and will always need to explore the variables in great depth before you can move on to building a model or doing something else with the data. Effective data visualization is the most important tool in your arsenal for getting this done, and hence an critical skill for you to master. You can learn digital marketing courses form Easyshiksha Online.

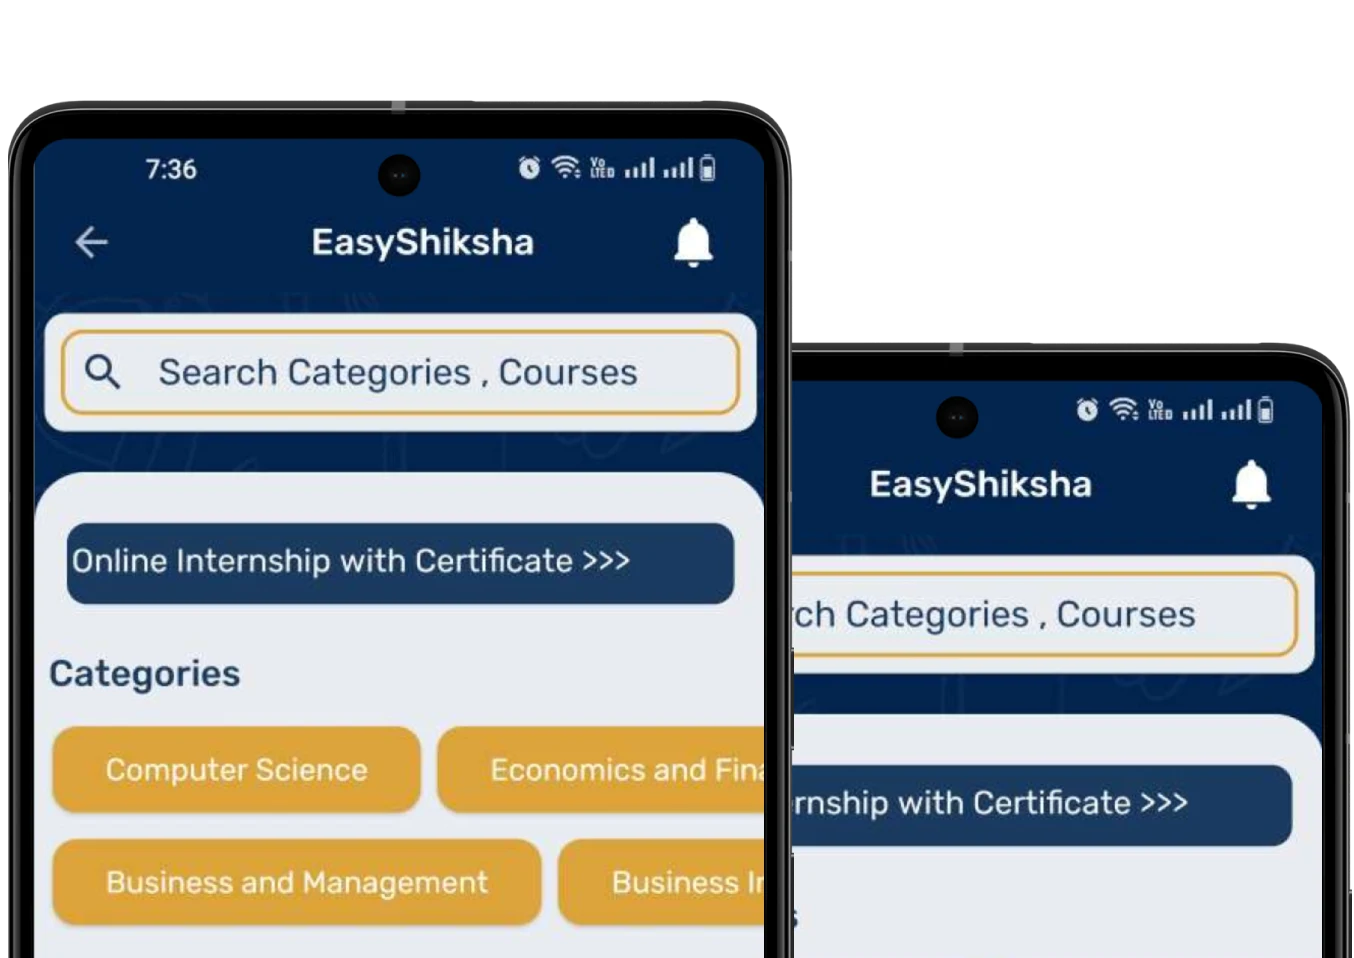
Important Announcement – EasyShiksha has now started Online Internship Program “Ab India Sikhega Ghar Se”
free amazing data sources for data visualization are:
- Google Trends: Google Trends shows how often a particular search-term is entered relative to the total search-volume across various regions of the world in various languages.
- Amazon API: Browse Amazon Web Services’ Public Data Sets by category for a huge wealth of information. Amazon API Gateway allows developers to securely connect mobile and web applications to APIs that run on Amazon Web(AWS) Lambda, Amazon EC2, or other publicly addressable web services that are hosted outside of AWS.
- World Bank Open Data: Education statistics about everything from finances to service delivery indicators around the world.
Top Courses in Software Engineering Top Courses in Software Engineering
Loading...
- The CIA World Factbook: Facts on every country in the world; focuses on history, government, population, economy, energy, geography, communications, transportation, military, and transnational issues of 267 countries.
- Facebook API: Learn how to publish to and retrieve data from Facebook using the Graph API.
- Twitter API: The Twitter Platform connects your website or application with the worldwide conversation happening on Twitter.
- Instagram API: The Instagram API Platform can be used to build non-automated, authentic, high-quality apps and service.
- World Health Organisation: statistics concerning nutrition, disease, and health in more than 150 countries.
I hope you like this blog, amazing data sources for data visualization. To Learn more visit HawksCode and Easyshiksha Courses.
Empower your team. Lead the industry
Get a subscription to a library of online courses and digital learning tools for your organization with EasyShiksha
Request NowQ. Are EasyShiksha's internships truly free?
Yes, all internships offered by EasyShiksha are completely free of charge.
Q. How can I apply for an internship with EasyShiksha?
You can apply by visiting our website, browsing available internships, and following the application instructions provided.
Q. What types of internships are available through EasyShiksha?
EasyShiksha offers a wide range of internships across technology, business, marketing, healthcare, and more. Opportunities are continuously updated.
Q. Will I receive a certificate upon completing an internship?
Yes, upon successful completion, you will receive a certificate recognizing your participation and achievements.
Q. Are EasyShiksha's internship certificates recognized by universities and employers?
Yes, the certificates are recognized by universities, colleges, and employers worldwide.
Q. Is the download of certificates free or paid?
Access to internships and courses is free, but there is a small fee to download certificates, covering administrative costs.
Q. When can I start the course?
You can choose any course and start immediately without delay.
Q. What are the course and session timings?
These are fully online courses. You can learn at any time and pace. We recommend following a routine, but it depends on your schedule.
Q. What will happen when my course is over?
After completion, you will have lifetime access to the course for future reference.
Q. Can I download the notes and study material?
Yes, you can access and download course materials and have lifetime access for future reference.
Q. What software/tools would be needed for the course?
All necessary software/tools will be shared during the training as needed.
Q. I’m unable to make a payment. What should I do?
Try using a different card or account. If the problem persists, email us at info@easyshiksha.com.
Q. Do I get the certificate in hard copy?
No, only a soft copy is provided, which can be downloaded and printed if required.
Q. The payment got deducted but shows “failed”. What to do?
Technical errors may cause this. The deducted amount will be returned to your account in 7-10 working days.
Q. Payment was successful but dashboard shows ‘Buy Now’?
Sometimes payment reflection is delayed. If it takes longer than 30 minutes, email info@easyshiksha.com with the payment screenshot.
Q. What is the refund policy?
If you face technical issues, you can request a refund. No refunds are issued once the certificate has been generated.
Q. Can I enroll in a single course?
Yes, select the course of interest, fill in the details, make payment, and start learning. You will also earn a certificate.
Q. My questions are not listed above. I need further help.
Contact us at info@easyshiksha.com for further assistance.
ALSO READ: ai-based-cameras-help-hyderabad-police
Get Course: Online-Sociology-Courses
